
COT report: Case Study on the Canadian Dollar
MARKET ANALYSES
All COT data is provided by a single source: Tradingster.com
My observation is rooted in a proven Swing strategy that finds its preliminary confirmation in the analysis of the COT Report published every Friday. Understanding how institutional players are positioning orders for tactical asset allocation provides a significant statistical advantage.
However, an incorrect analysis of the COT Report turns into a total disadvantage, leading to the misconception that the numbers you read on the "non-commercial" side provide information contrary to the price action. This is not the case. The case study we will examine in this analysis concerns the Canadian Dollar Index future.
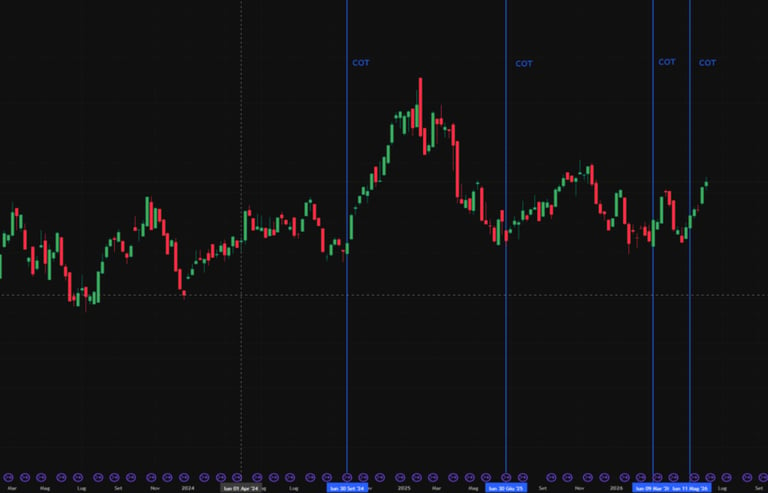
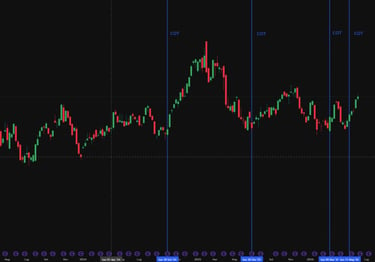
https://it.tradingview.com/chart/2BpSMPQn/?symbol=BMFBOVESPA%3ACAN1%21
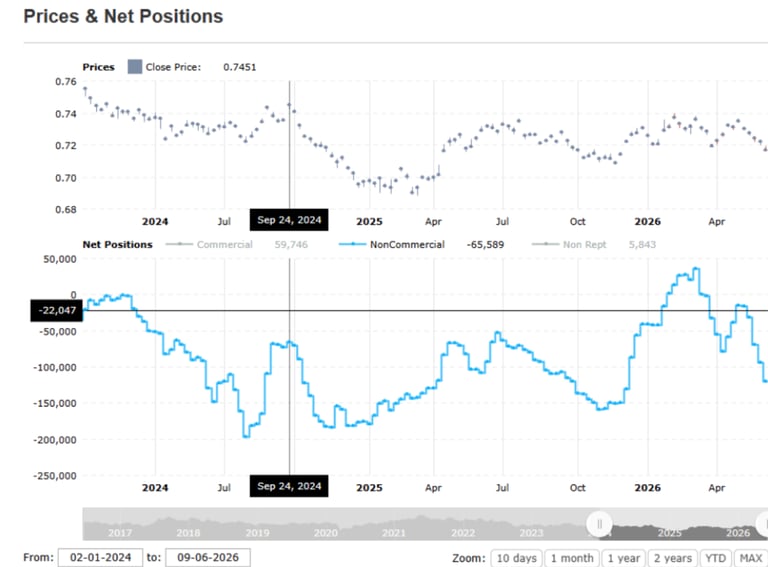
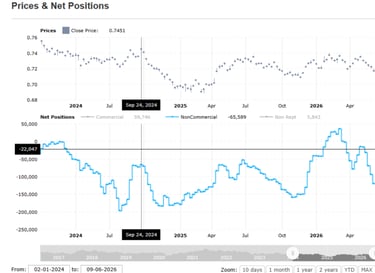
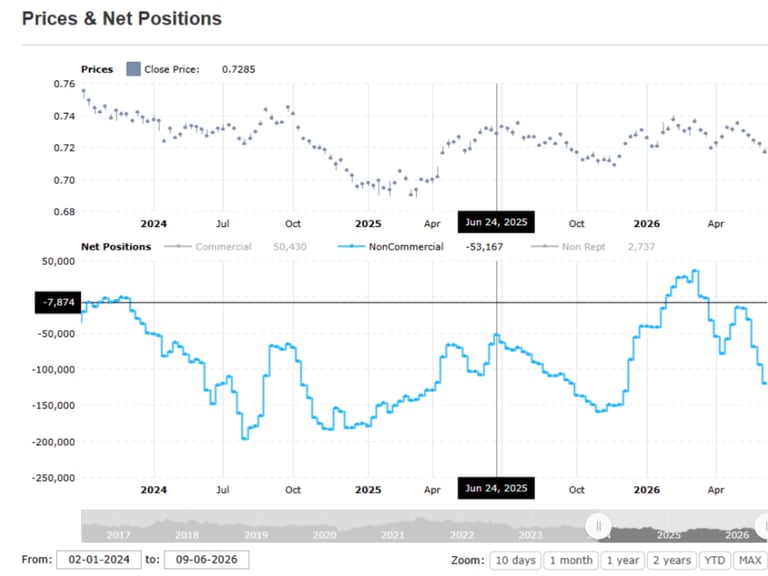
On the chart, I have highlighted four weekly initiative candles, which were decisive for the construction of the asset's future up-trend. Below, I upload these exact four weeks of the COT Report in chronological order.
On September 24, 2024, we are at the subsequent high after a strong bearish trend.
On June 24, 2025, we find ourselves at the high after a bullish trend.
gritticc@gmail.com
+355 69 482 8584
Gritti C&C | P.IVA / NIPT M61614111O | © 2026 All Rights Reserved
Consulting
Academy
Research
Privacy Policy
Terms and Conditions